Boosting Superstore Profit with Smart Recommendations
Developed a full-stack retail analytics platform using Java, Spring Boot, Vaadin, and Power BI to help customers and business leaders understand purchasing behavior, identify performance issues, and make data-driven decisions.
The goal of this project was to transform raw Superstore sales data into a practical analytics platform that supports both customers and business leaders.
We developed two connected dashboards:
A Customer Dashboard that provides personalized purchasing insights.
A Corporate Dashboard that helps managers analyze sales, profit, discounts, customer segments, and regional performance.
The application combines secure login functionality, interactive visualizations, data filtering, statistical analysis, and an embedded Power BI map. By bringing these capabilities together, the platform allows users to move beyond static spreadsheets and interact directly with the data.
Business Problem
Superstore stakeholders needed a faster and more intuitive way to answer questions such as:
Which products and regions generate the most profit?
Which categories or sub-categories are producing losses?
How do discounts affect sales volume and profitability?
How does performance vary across customer segments?
Which cities contribute the most to total sales and profit?
How can individual customers better understand their purchasing behavior?
Analyzing these questions manually would require filtering multiple spreadsheets, creating separate pivot tables, and rebuilding charts for each scenario.
Our solution centralizes the analysis in one application and allows users to adjust filters and visualizations in real time.
Technologies Used
Area
Technology
Programming language
Java
Application framework
Spring Boot
User interface
Vaadin
Data processing
Java Streams, OpenCSV, Tablesaw
Visualizations
Vaadin Charts, Power BI
Build management
Maven
Version control
Git
Supporting analysis
Microsoft Excel and Power BI
System Architecture
The application follows a layered structure:
Superstore CSV Data
        │
        ▼
Data Models and CSV Parsers
        │
        ▼
Java and Spring Boot Logic
        │
        ▼
Filtering and Data Aggregation
        │
        ▼
Vaadin User Interface
        │
        ▼
Interactive Charts, Tables, and Power BI Map
Data Layer
The original Superstore dataset and supporting analysis files were stored as CSV files. Java model classes represented customers, transactions, profit margins, discount bands, and product performance.
Application Layer
Spring Boot handled the main application structure, while Java Streams were used to filter, group, and aggregate the data.
Presentation Layer
Vaadin was used to build the interface, including:
Login forms
Customer profiles
Purchase-history tables
Dropdown controls
Interactive charts
Data grids
Dashboard layouts
Power BI was embedded inside the application for geographic analysis.
Customer Dashboard
Purpose
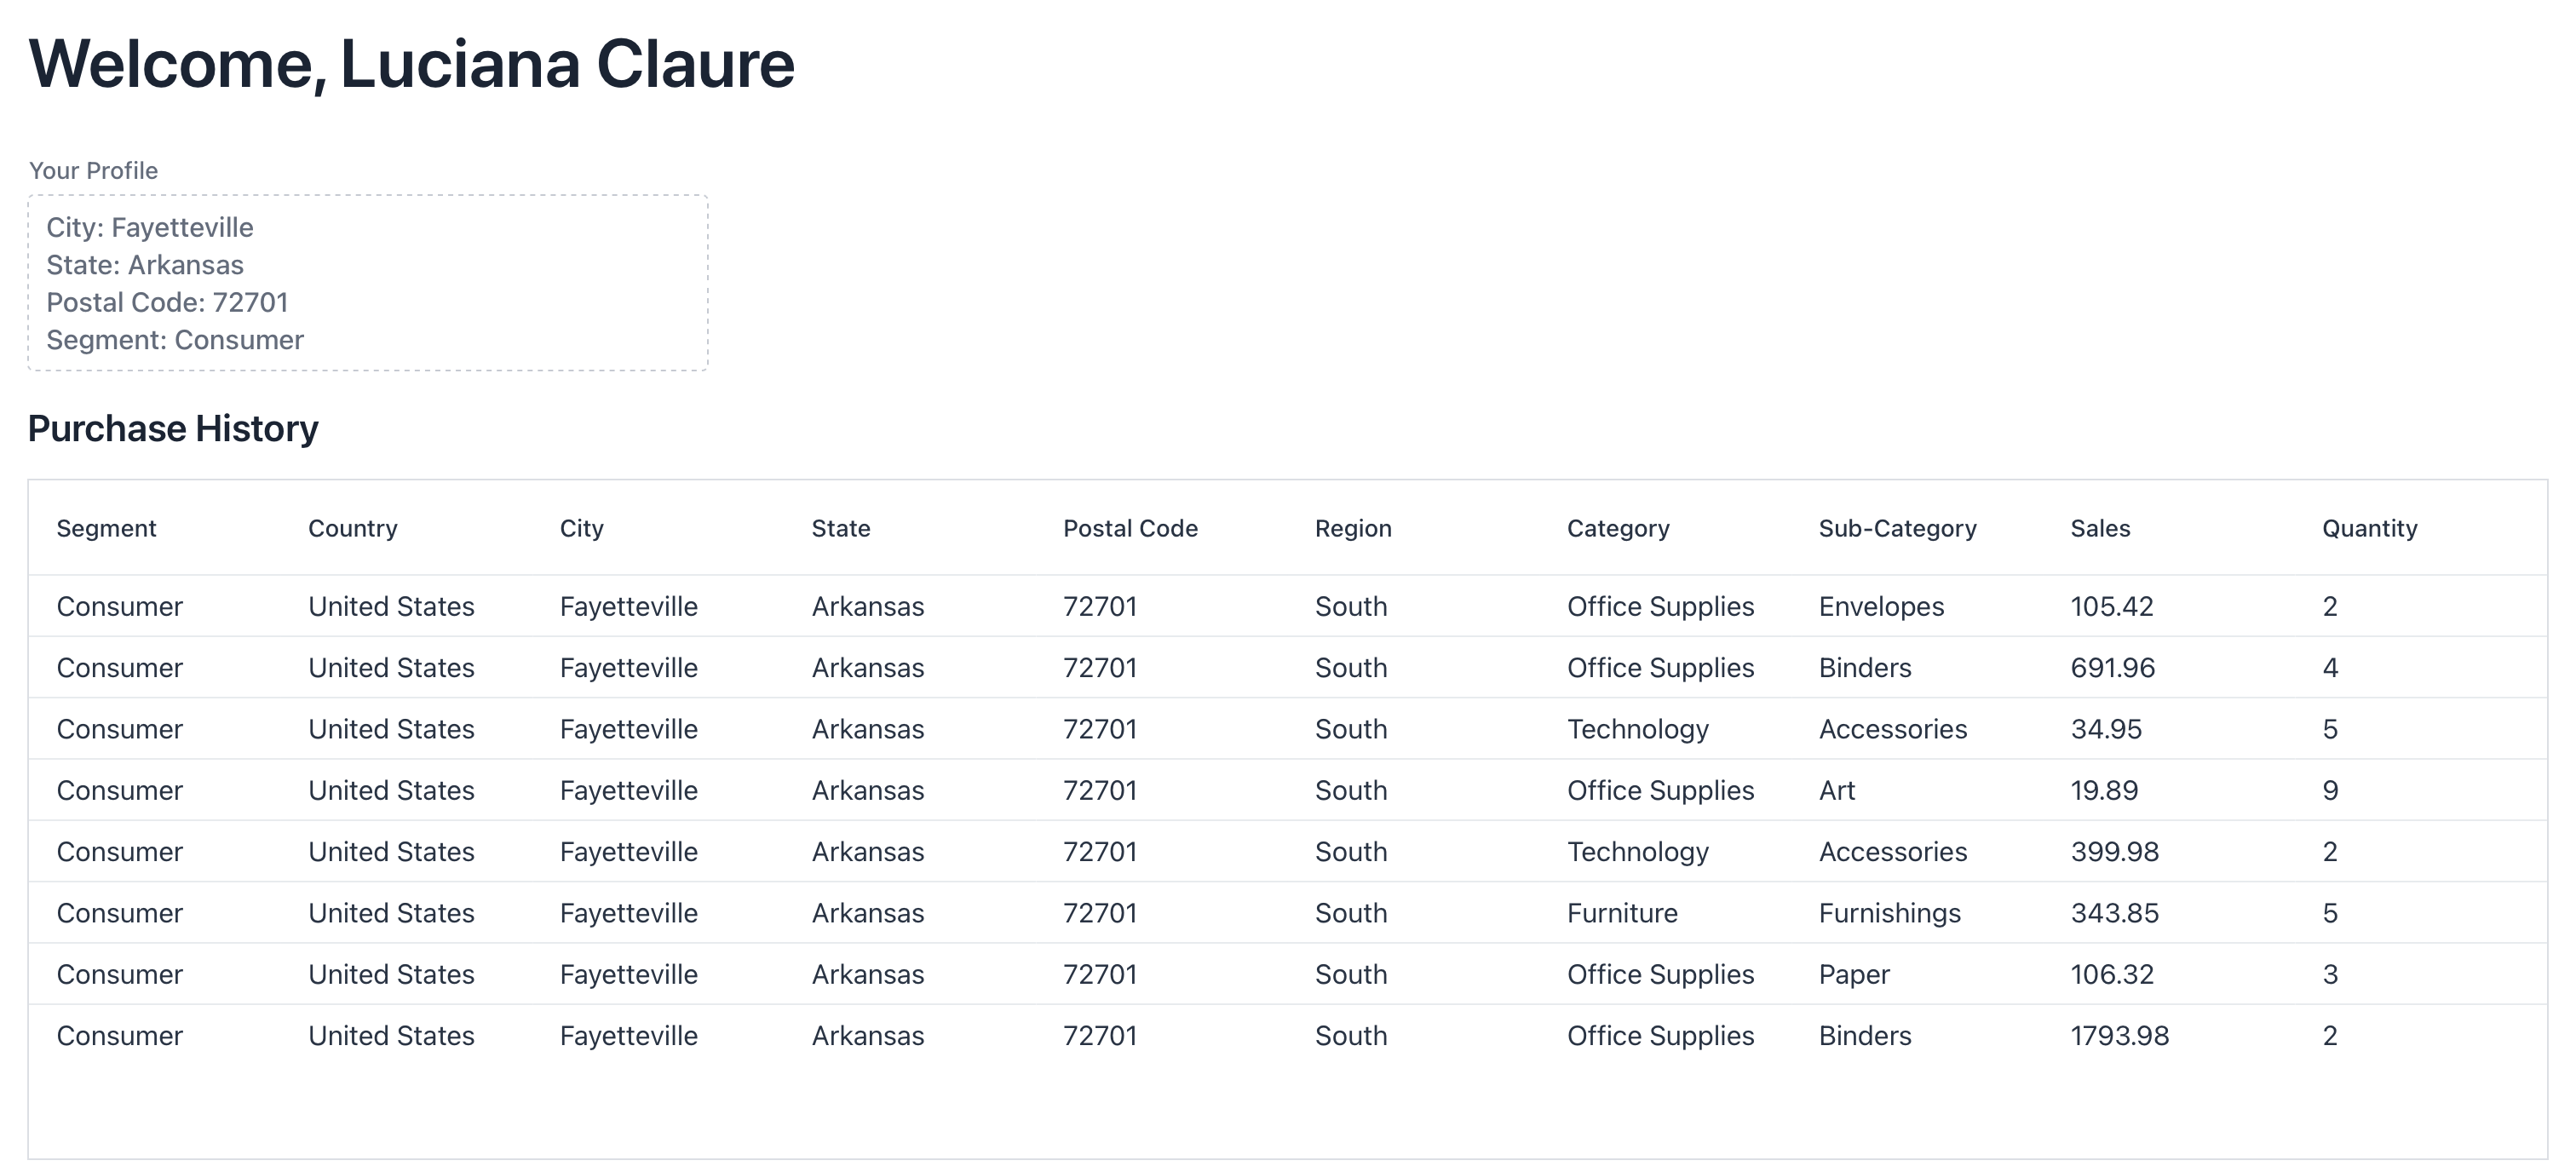
The Customer Dashboard was designed to provide each registered customer with a personalized view of their purchasing behavior.
After logging in, the application retrieves the customer’s location and segment information from the active session. It then identifies the corresponding customer profile and filters the Superstore transaction dataset so that only the customer’s purchase history is displayed.
The dashboard includes a customer profile, purchase history, spending visualizations, and interactive statistics. :contentReferenceoaicite:0
Main Features
Personalized welcome message
Customer profile information
Complete purchase history
Spending by product category
Spending by product sub-category
Mean, mode, and range calculations
Interactive controls for sales and quantity analysis
Error handling when no purchase history is available
Customer Profile
The profile section displays:
First and last name
City
State
ZIP code
Customer segment
The application uses session values to match the authenticated user with the correct record in the customer-registration dataset.
Spending Visualizations
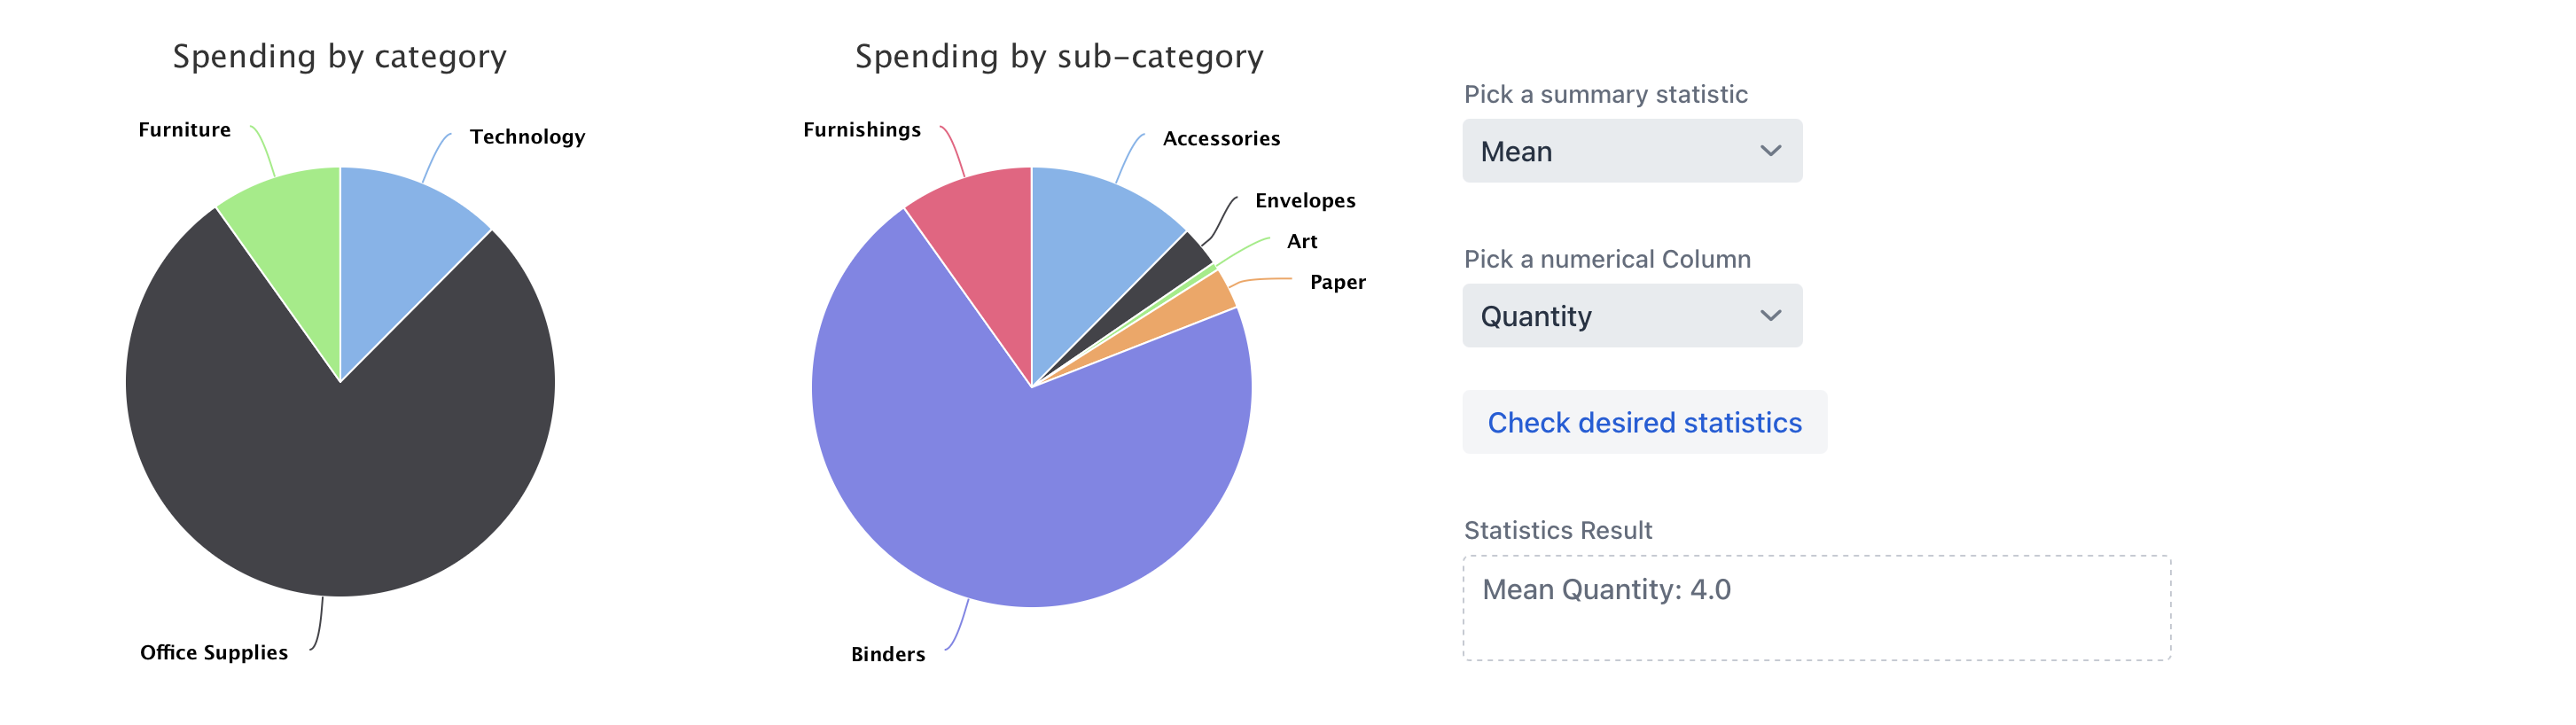
Two interactive pie charts show how the customer’s spending is distributed.
Spending by Category
Transactions are grouped into the main Superstore categories:
Furniture
Office Supplies
Technology
Code for Customer Dashboard
Show code
@Route(value ="dashboard")publicclass CustomerDashboard extends VerticalLayout {/* This is where we are manually working through: - past purchase history - what categories they typically purchase - profile information - contact number (if they have issues) - make it look readable */publicCustomerDashboard()throwsFileNotFoundException{String userState =(String) UI.getCurrent().getSession().getAttribute("state");String userCity =(String) UI.getCurrent().getSession().getAttribute("city");String userPostalCode =(String) UI.getCurrent().getSession().getAttribute("postalCode");String userSegment =(String) UI.getCurrent().getSession().getAttribute("segment");String userFirstName =(String) UI.getCurrent().getSession().getAttribute("firstName");String userLastName =(String) UI.getCurrent().getSession().getAttribute("lastName");try{List<SuperStoreUser> purchases =new CsvToBeanBuilder<SuperStoreUser>(newFileReader("data/SuperStore Dataset.csv")).withType(SuperStoreUser.class).build().parse();List<RegisteredUser> registeredList =new CsvToBeanBuilder<RegisteredUser>(newFileReader("data/SuperStoreLoginInfo.csv")).withType(RegisteredUser.class).build().parse();// Find matching registered user RegisteredUser matchedUser = registeredList.stream().filter(u -> u.getState().trim().equalsIgnoreCase(userState)&& u.getPostalCode().trim().equalsIgnoreCase(userPostalCode)&& u.getCity().trim().equalsIgnoreCase(userCity)&& u.getSegment().trim().equalsIgnoreCase(userSegment)).findFirst().orElse(null);if(matchedUser !=null){add(newH1("Welcome, "+ matchedUser.getFirstName()+" "+ matchedUser.getLastName()));TextArea profileInfo =newTextArea(); profileInfo.setLabel("Your Profile"); profileInfo.setWidth("400px"); profileInfo.setValue("City: "+ matchedUser.getCity()+"\nState: "+ matchedUser.getState()+"\nPostal Code: "+ matchedUser.getPostalCode()+"\nSegment: "+ matchedUser.getSegment()); profileInfo.setReadOnly(true);add(profileInfo);}// Filter PurchasesList<SuperStoreUser> matchedPurchases = purchases.stream().filter(u -> u.getState().trim().equalsIgnoreCase(userState)).filter(u -> u.getPostalCode().trim().equalsIgnoreCase(userPostalCode)).filter(u -> u.getCity().trim().equalsIgnoreCase(userCity)).filter(u -> u.getSegment().trim().equalsIgnoreCase(userSegment)).collect(Collectors.toList());if(matchedPurchases.isEmpty()){ H3 noPurchases =newH3("You don't have any purchase history yet. Continue Shopping with us!");add(noPurchases);return;}// Grid H3 gridTitle =newH3("Purchase History"); Grid<SuperStoreUser> purchasesGrid =new Grid<>(SuperStoreUser.class); purchasesGrid.setItems(matchedPurchases); purchasesGrid.removeAllColumns(); purchasesGrid.addColumn(SuperStoreUser::getSegment).setHeader("Segment"); purchasesGrid.addColumn(SuperStoreUser::getCountry).setHeader("Country"); purchasesGrid.addColumn(SuperStoreUser::getCity).setHeader("City"); purchasesGrid.addColumn(SuperStoreUser::getState).setHeader("State"); purchasesGrid.addColumn(SuperStoreUser::getPostalCode).setHeader("Postal Code"); purchasesGrid.addColumn(SuperStoreUser::getRegion).setHeader("Region"); purchasesGrid.addColumn(SuperStoreUser::getCategory).setHeader("Category"); purchasesGrid.addColumn(SuperStoreUser::getSubCategory).setHeader("Sub-Category"); purchasesGrid.addColumn(SuperStoreUser::getSales).setHeader("Sales"); purchasesGrid.addColumn(SuperStoreUser::getQuantity).setHeader("Quantity");add(gridTitle, purchasesGrid);// Pie charts & summary controls Chart catPieChart =newChart(ChartType.PIE);Configuration conf = catPieChart.getConfiguration(); conf.setTitle("Spending by category"); HorizontalLayout pieCharts =newHorizontalLayout(); DataSeries series =newDataSeries(); matchedPurchases.stream().collect(Collectors.groupingBy(SuperStoreUser::getCategory, Collectors.summingDouble(SuperStoreUser::getSales))).forEach((category, totalSales)->{if(totalSales >0){ series.add(newDataSeriesItem(category, totalSales));}}); conf.setSeries(series); Chart subPieChart =newChart(ChartType.PIE);Configuration subPieConf = subPieChart.getConfiguration(); subPieConf.setTitle("Spending by sub-category"); DataSeries subPieSeries =newDataSeries(); matchedPurchases.stream().collect(Collectors.groupingBy(SuperStoreUser::getSubCategory, Collectors.summingDouble(SuperStoreUser::getSales))).forEach((subCategory, totalSales)->{if(totalSales >0){ subPieSeries.add(newDataSeriesItem(subCategory, totalSales));}}); subPieConf.setSeries(subPieSeries); VerticalLayout summary =newVerticalLayout();TextArea summaryStatistics =newTextArea("Statistics Result"); summaryStatistics.setWidth("400px"); summaryStatistics.setReadOnly(true); ComboBox<String> statisticOptions =new ComboBox<>("Pick a summary statistic"); statisticOptions.setItems("Mean","Mode","Range"); ComboBox<String> numericalColumn =new ComboBox<>("Pick a numerical Column"); numericalColumn.setItems("Sales","Quantity");Button statisticsButton =newButton("Check desired statistics"); statisticsButton.addClickListener(n ->{String selectedStatistic = statisticOptions.getValue();String selectedColumn = numericalColumn.getValue();if(selectedStatistic ==null|| selectedColumn ==null){ summaryStatistics.setValue("Please pick both a statistic and a column");return;}List<Double> valuesToAnalyze =newArrayList<>();switch(selectedColumn){case"Sales": valuesToAnalyze = matchedPurchases.stream().map(SuperStoreUser::getSales).collect(Collectors.toList());break;case"Quantity": valuesToAnalyze = matchedPurchases.stream().map(u ->(double) u.getQuantity()).collect(Collectors.toList());break;}if(valuesToAnalyze.isEmpty()){ summaryStatistics.setValue("No data available for selected column.");return;}if(selectedStatistic.equalsIgnoreCase("Mean")){double mean = valuesToAnalyze.stream().mapToDouble(Double::doubleValue).average().orElse(0.0); summaryStatistics.setValue("Mean "+ selectedColumn +": "+ mean);}elseif(selectedStatistic.equalsIgnoreCase("Mode")){double mode = valuesToAnalyze.stream().collect(Collectors.groupingBy(p -> p, Collectors.counting())).entrySet().stream().max((e1, e2)-> e1.getValue().compareTo(e2.getValue())).map(e -> e.getKey()).orElse(0.0); summaryStatistics.setValue("Mode "+ selectedColumn +": "+ mode);}elseif(selectedStatistic.equalsIgnoreCase("Range")){double max = valuesToAnalyze.stream().mapToDouble(Double::doubleValue).max().orElse(0.0);double min = valuesToAnalyze.stream().mapToDouble(Double::doubleValue).min().orElse(0.0); summaryStatistics.setValue("Range "+ selectedColumn +": "+(max - min));}}); summary.add(statisticOptions, numericalColumn, statisticsButton, summaryStatistics); pieCharts.add(catPieChart, subPieChart, summary);add(pieCharts);}catch(FileNotFoundException e){Notification.show("File not found");}}}
SuperStore Corporate Dashboard
The SuperStore Dashboard is an interactive tool created to help analysts, managers, and stakeholders make smarter decisions using data. It gives a clear and complete picture of key business metrics like profit, sales, quantity, and profit margin. Everything is neatly organized by region, product category, sub-category, customer segment, and discount level, so users can easily focus on the areas that matter most to them and tailor their analysis to specific goals.
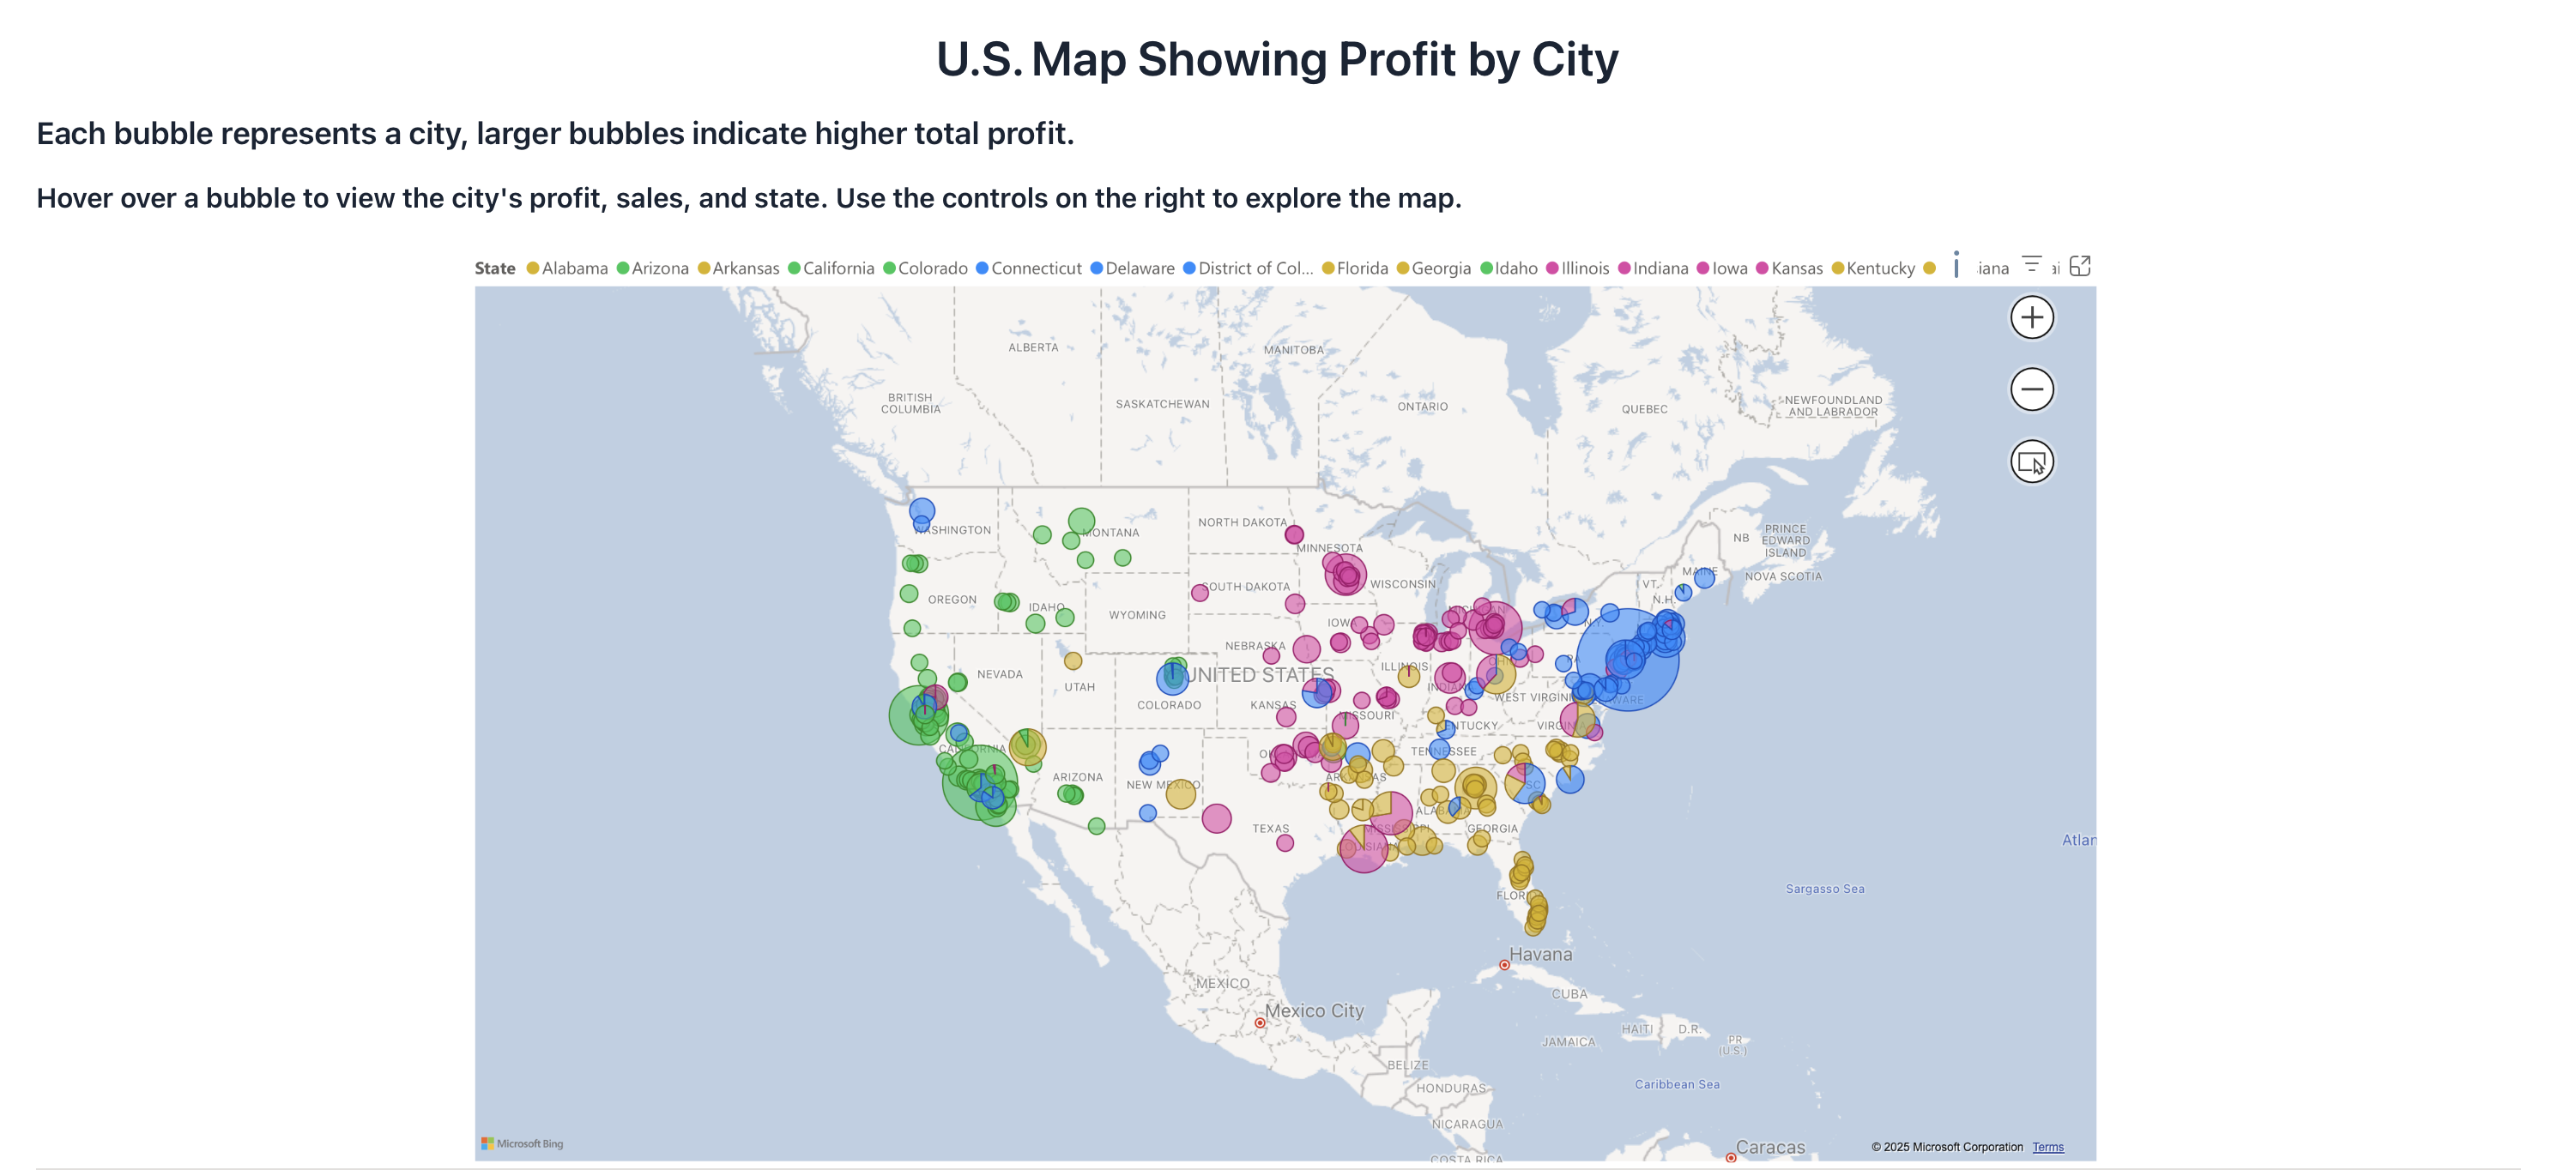
The dashboard is built to be easy to use, with clean and intuitive visualizations that make the data simple to explore and understand. Because the information is confidential, access is restricted through a secure login to ensure it’s only available to authorized users. It includes a variety of visual tools, such as pie and bar charts, that show how different customer segments contribute to overall sales and profit. Users can apply filters to dig deeper into loss areas, uncover performance trends, and explore how profits vary across categories and sub-categories. One of the highlights is an interactive U.S. map that displays total profit and sales by city, using bubble sizes to reflect each location’s performance.
The entire dashboard is designed to make business insights not only accessible but also easy to act on. Whether someone wants to do a deep dive into the numbers or just get a quick overview, the information is right there, organized, clear, and ready to support better decisions.
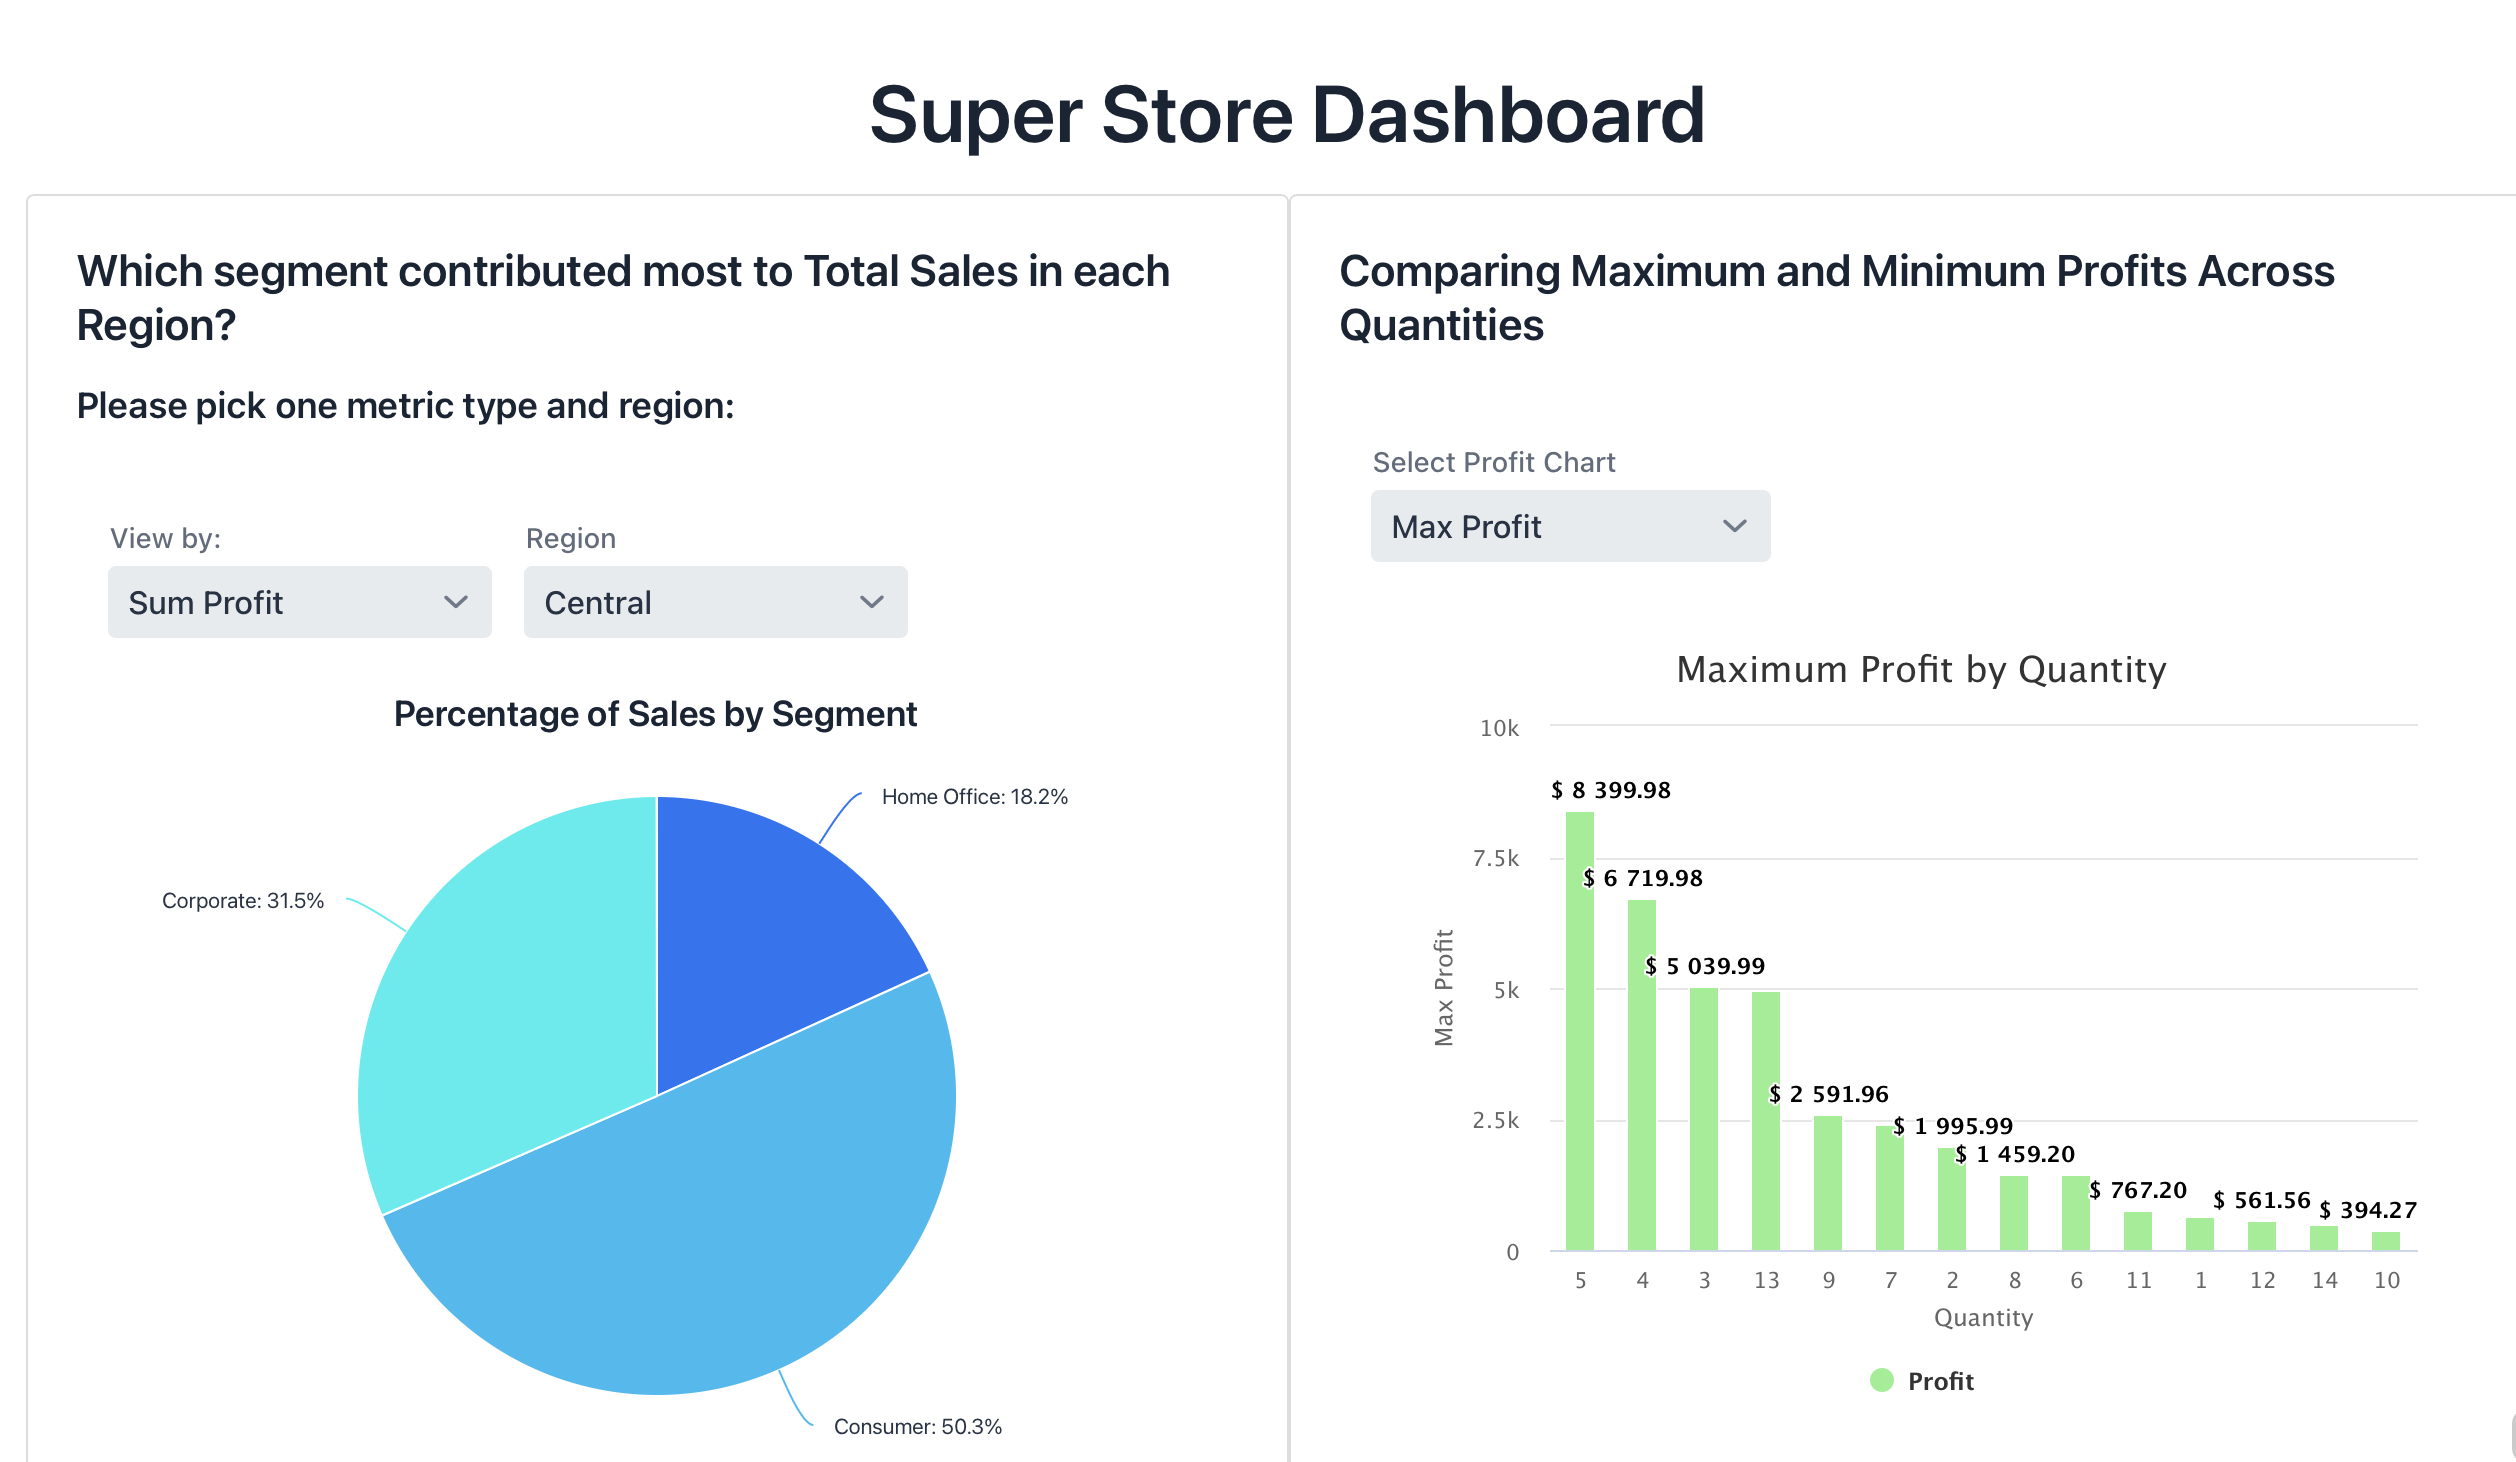
Percentage of Sales by Segment and Region & Maximum Profit by Quantity
Below is a side-by-side view of the pie chart showing each segment’s share of total sales in the selected region, alongside a bar chart comparing maximum profits at different order quantities:
Code for Pie Charts
Show code
privatefinalMap<String,Map<String,Double>> regionData =newLinkedHashMap<>();privatefinalMap<String,Map<String,Double>> meanSegment =newLinkedHashMap<>();privateComponentcreatePieChart()throwsFileNotFoundException{loadRegionData();loadMeanSegmentData();// adding a pickChart button so user could pick between two different statistical metrics. ComboBox<String> pickChart =new ComboBox<>("View by:"); pickChart.setItems("Sum Profit","Mean Profit"); pickChart.setValue("Sum Profit"); pickChart.setWidthFull();// adding a selectRegion button so user could pick between the 4 different regions in the USA. ComboBox<String> selectRegion =new ComboBox<>("Region"); selectRegion.setItems("Central","East","South","West"); selectRegion.setValue("Central"); selectRegion.setWidthFull(); HorizontalLayout headerLayout =newHorizontalLayout(pickChart, selectRegion);add(headerLayout);// Chart setup Chart chart =newChart(ChartType.PIE);Configuration conf = chart.getConfiguration(); conf.getChart().setStyledMode(true); chart.setThemeName("gradient"); DataSeries series =newDataSeries(); conf.setSeries(series);// Adding percentages to the graph PlotOptionsPie options =newPlotOptionsPie(); DataLabels labels =newDataLabels(); labels.setEnabled(true); labels.setFormat("{point.name}: {point.percentage:.1f}%"); options.setDataLabels(labels); conf.setPlotOptions(options);// Chart updaterRunnable updateChart =()->{String region = selectRegion.getValue();String type = pickChart.getValue(); conf.setTitle("Percentage of Sales by Segment");Map<String,Double> data = type.equals("Sum Profit")? regionData.get(region): meanSegment.get(region); DataSeries series2 =newDataSeries();for(String segment : data.keySet()){ series2.add(newDataSeriesItem(segment, data.get(segment)));} conf.setSeries(series2); chart.drawChart();}; updateChart.run(); pickChart.addValueChangeListener(e -> updateChart.run()); selectRegion.addValueChangeListener(e -> updateChart.run()); VerticalLayout layout =newVerticalLayout(headerLayout, chart); layout.setSizeFull();return layout;}privatevoidloadRegionData()throwsFileNotFoundException{// CentralFileReader centralReader =newFileReader("data/Segment Percent Central Region.csv");List<SegmentPercent> centralList =new CsvToBeanBuilder<SegmentPercent>(centralReader).withType(SegmentPercent.class).withIgnoreLeadingWhiteSpace(true).build().parse();// East, South, West similarly…// (repeat parsing and put into regionData map) regionData.put("Central",toMap(centralList));// … add East, South, West}privatevoidloadMeanSegmentData()throwsFileNotFoundException{// CentralFileReader centralReader =newFileReader("data/Mean Segment Percent Central Region.csv");List<SegmentPercent> centralList2 =new CsvToBeanBuilder<SegmentPercent>(centralReader).withType(SegmentPercent.class).withIgnoreLeadingWhiteSpace(true).build().parse();// East, South, West similarly… meanSegment.put("Central",toMap(centralList2));// … add East, South, West}privateMap<String,Double>toMap(List<SegmentPercent> list){Map<String,Double> map =newLinkedHashMap<>();for(SegmentPercent sp : list){ map.put(sp.getSegment(), sp.getPercent());}return map;}// Lowest-performing sub-categories viewprivateList<LowestPerforming> centralLowestData, eastLowestData, southLowestData, westLowestData;privateComponentLowestPerformingSubCategories()throwsFileNotFoundException{loadLowestPerformingData();setSizeFull(); ComboBox<String> selectRegion =new ComboBox<>("Region",List.of("Central","East","South","West")); ComboBox<String> selectSegment =new ComboBox<>("Segment",List.of("Consumer","Corporate","Home Office")); ComboBox<String> selectCategory =new ComboBox<>("Category",List.of("Furniture","Office Supplies","Technology")); HorizontalLayout header =newHorizontalLayout(selectRegion, selectSegment, selectCategory); Grid<LowestPerforming> grid =new Grid<>(LowestPerforming.class,false); grid.addThemeVariants(GridVariant.LUMO_COLUMN_BORDERS); grid.setAllRowsVisible(true); grid.addColumn(LowestPerforming::getRegion).setHeader("Region").setAutoWidth(true); grid.addColumn(LowestPerforming::getCategory).setHeader("Category").setAutoWidth(true); grid.addColumn(LowestPerforming::getSubCategory).setHeader("Sub-Category").setAutoWidth(true); grid.addColumn(LowestPerforming::getSegment).setHeader("Segment").setAutoWidth(true); grid.addColumn(LowestPerforming::getProfit).setHeader("Profit").setTextAlign(ColumnTextAlign.END).setAutoWidth(true); grid.setItems(centralLowestData);Runnable changeGrid =()->{List<LowestPerforming> base =switch(selectRegion.getValue()){case"East"-> eastLowestData;case"South"-> southLowestData;case"West"-> westLowestData;default-> centralLowestData;};List<LowestPerforming> filtered = base.stream().filter(lp -> lp.getSegment().equals(selectSegment.getValue())).filter(lp -> lp.getCategory().equals(selectCategory.getValue())).toList(); grid.setItems(filtered);}; selectRegion.addValueChangeListener(e -> changeGrid.run()); selectSegment.addValueChangeListener(e -> changeGrid.run()); selectCategory.addValueChangeListener(e -> changeGrid.run()); changeGrid.run(); VerticalLayout layout =newVerticalLayout(header, grid); layout.setPadding(false); layout.setSpacing(false); layout.addClassName(LumoUtility.Padding.LARGE); layout.getElement().getThemeList().add("spacing-l");return layout;}privatevoidloadLowestPerformingData()throwsFileNotFoundException{// Central centralLowestData =new CsvToBeanBuilder<LowestPerforming>(newFileReader("data/Lowest Performing SubCategories Central Region.csv")).withType(LowestPerforming.class).withIgnoreLeadingWhiteSpace(true).build().parse();// East, South, West similarly…}
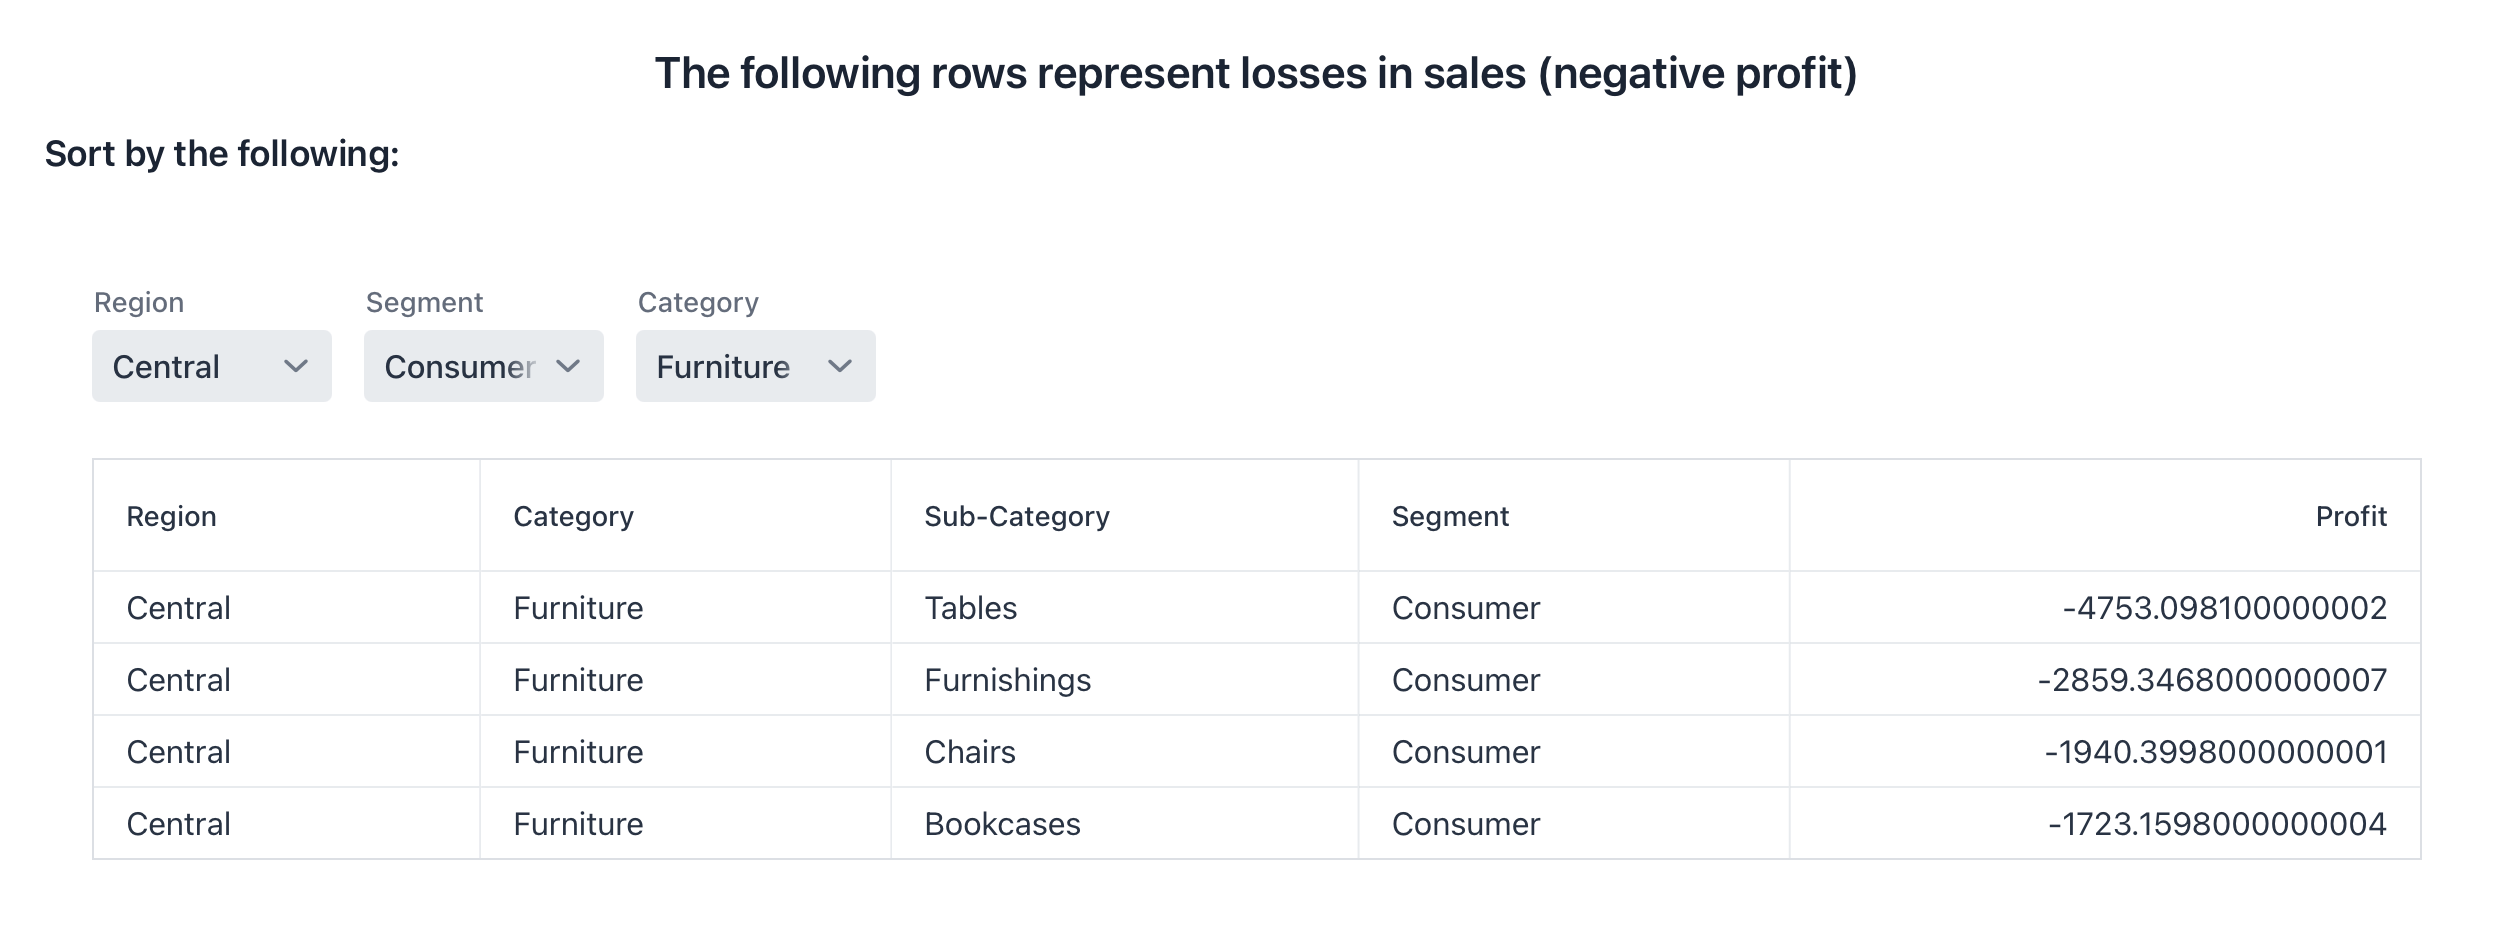
Rows Representing Losses in Sales (Negative Profit)
Here is the filtered table listing only those category/sub-category combinations that produced a loss in the chosen region, segment and category:
Code for adjustable grid
Show code
// In this case we look for rows with negative profit (< 0). // We aggregate Sales to analyze losses by Region, Category, and Segment. // We display Sub-Category in the table (too many to filter effectively).privateList<LowestPerforming> centralLowestData;privateList<LowestPerforming> eastLowestData;privateList<LowestPerforming> southLowestData;privateList<LowestPerforming> westLowestData;privateComponentLowestPerformingSubCategories()throwsFileNotFoundException{loadLowestPerformingData();setSizeFull(); ComboBox<String> selectRegion =new ComboBox<>("Region"); selectRegion.setItems("Central","East","South","West"); selectRegion.setValue("Central"); selectRegion.setWidth("120px"); ComboBox<String> selectSegment =new ComboBox<>("Segment"); selectSegment.setItems("Consumer","Corporate","Home Office"); selectSegment.setValue("Consumer"); selectSegment.setWidth("120px"); ComboBox<String> selectCategory =new ComboBox<>("Category"); selectCategory.setItems("Furniture","Office Supplies","Technology"); selectCategory.setValue("Furniture"); selectCategory.setWidth("120px"); HorizontalLayout header =newHorizontalLayout(selectRegion, selectSegment, selectCategory); Grid<LowestPerforming> grid =new Grid<>(LowestPerforming.class,false); grid.addThemeVariants(GridVariant.LUMO_COLUMN_BORDERS); grid.setAllRowsVisible(true); grid.addColumn(LowestPerforming::getRegion).setHeader("Region").setAutoWidth(true); grid.addColumn(LowestPerforming::getCategory).setHeader("Category").setAutoWidth(true); grid.addColumn(LowestPerforming::getSubCategory).setHeader("Sub-Category").setAutoWidth(true); grid.addColumn(LowestPerforming::getSegment).setHeader("Segment").setAutoWidth(true); grid.addColumn(LowestPerforming::getProfit).setHeader("Profit").setTextAlign(ColumnTextAlign.END).setAutoWidth(true);// default view grid.setItems(centralLowestData);Runnable changeGrid =()->{List<LowestPerforming> base =switch(selectRegion.getValue()){case"East"-> eastLowestData;case"South"-> southLowestData;case"West"-> westLowestData;default-> centralLowestData;};List<LowestPerforming> filtered = base.stream().filter(lp -> lp.getSegment().equals(selectSegment.getValue())).filter(lp -> lp.getCategory().equals(selectCategory.getValue())).toList(); grid.setItems(filtered);}; selectRegion.addValueChangeListener(e -> changeGrid.run()); selectSegment.addValueChangeListener(e -> changeGrid.run()); selectCategory.addValueChangeListener(e -> changeGrid.run()); changeGrid.run(); VerticalLayout layout =newVerticalLayout(header, grid); layout.setPadding(false); layout.setSpacing(false); layout.addClassName(LumoUtility.Padding.LARGE); layout.getElement().getThemeList().add("spacing-l");return layout;}privatevoidloadLowestPerformingData()throwsFileNotFoundException{ centralLowestData =new CsvToBeanBuilder<LowestPerforming>(newFileReader("data/Lowest Performing SubCategories Central Region.csv")).withType(LowestPerforming.class).withIgnoreLeadingWhiteSpace(true).build().parse(); eastLowestData =new CsvToBeanBuilder<LowestPerforming>(newFileReader("data/Lowest Performing SubCategories East Region.csv")).withType(LowestPerforming.class).withIgnoreLeadingWhiteSpace(true).build().parse(); southLowestData =new CsvToBeanBuilder<LowestPerforming>(newFileReader("data/Lowest Performing SubCategories South Region.csv")).withType(LowestPerforming.class).withIgnoreLeadingWhiteSpace(true).build().parse(); westLowestData =new CsvToBeanBuilder<LowestPerforming>(newFileReader("data/Lowest Performing SubCategories West Region.csv")).withType(LowestPerforming.class).withIgnoreLeadingWhiteSpace(true).build().parse();}
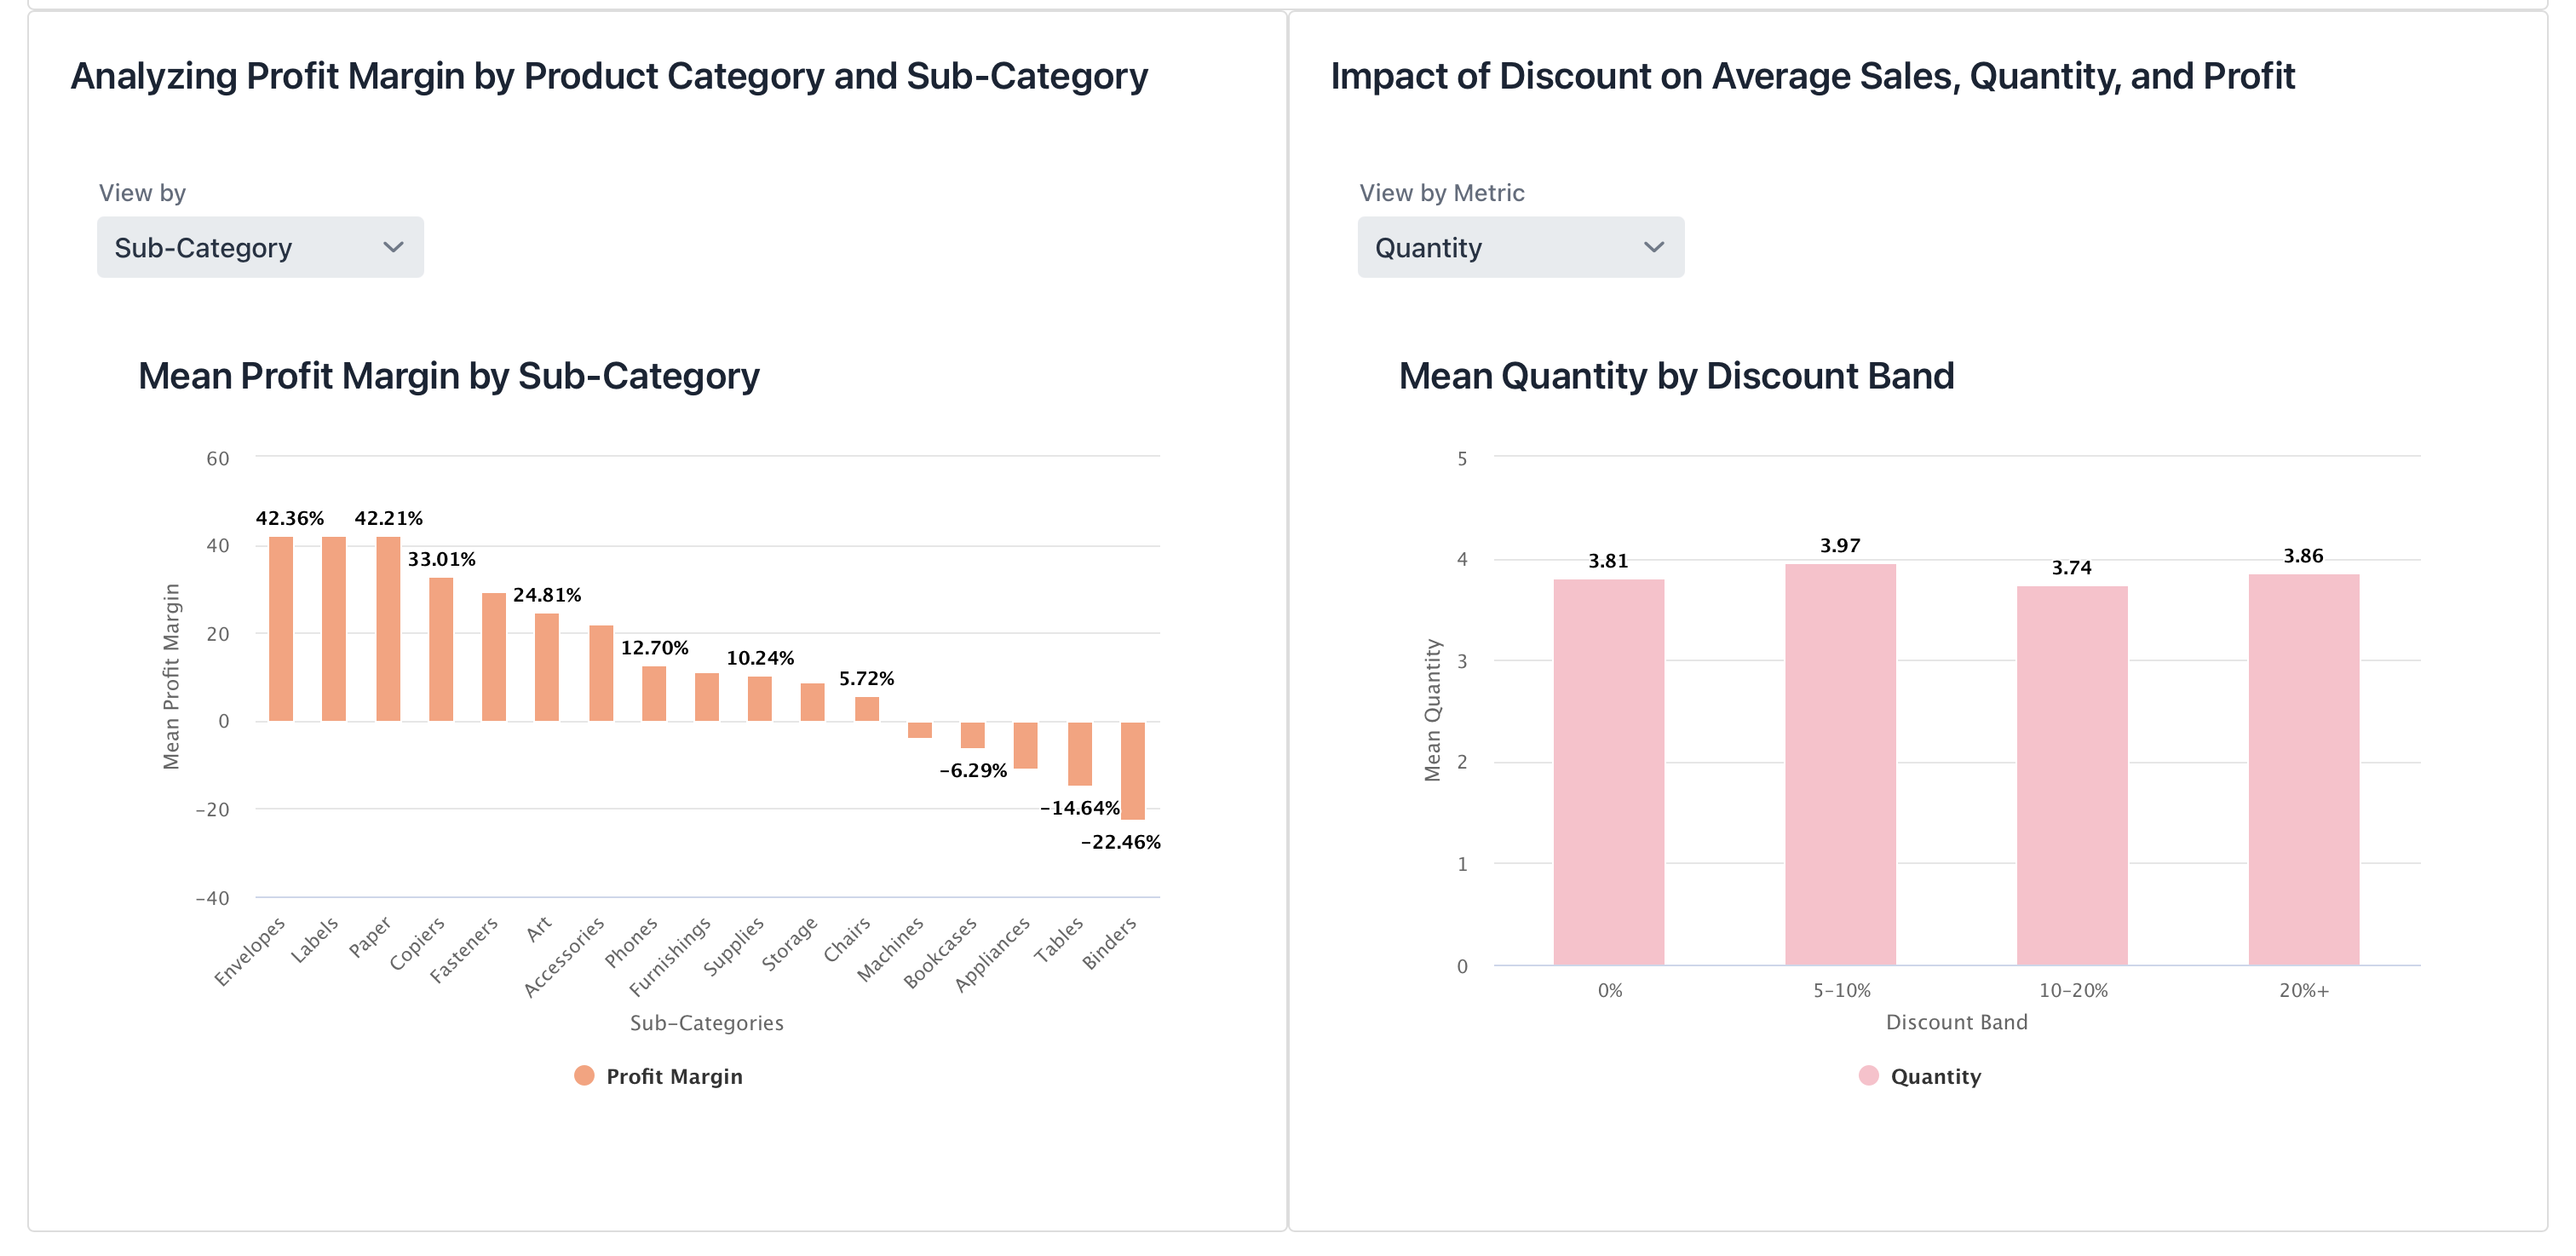
Analyzing Profit Margin & Impact of Discount
On the left, a bar chart displays mean profit margin by sub-category; on the right, a bar chart shows mean quantity sold across different discount bands:
Profit Margin Charts Code
Show code
// Analyze mean profit margin by Sub-Category and Category using bar chartsprivateList<ProfitMargin> profitMarginData;privateComponentcreateBarChartSubCategories()throwsFileNotFoundException{ H3 chartHeader =newH3("Mean Profit Margin by Sub-Category");loadProfitMarginData();// Group by sub-category (alphabetical) and averageMap<String,Double> avgBySubCategory = profitMarginData.stream().collect(Collectors.groupingBy( ProfitMargin::getSubcategory,TreeMap::new, Collectors.averagingDouble(ProfitMargin::getMeanProfit)));// Sort descending by value for categories/values arraysString[] categories = avgBySubCategory.entrySet().stream().sorted(Map.Entry.<String,Double>comparingByValue().reversed()).map(Map.Entry::getKey).toArray(String[]::new);Number[] values = avgBySubCategory.entrySet().stream().sorted(Map.Entry.<String,Double>comparingByValue().reversed()).map(Map.Entry::getValue).toArray(Number[]::new); Chart chart =newChart(ChartType.COLUMN);Configuration conf = chart.getConfiguration(); conf.getChart().setStyledMode(false); XAxis x =newXAxis(); x.setCategories(categories); x.setTitle("Sub-Categories"); conf.addxAxis(x); YAxis y =newYAxis(); y.setTitle("Mean Profit Margin"); conf.addyAxis(y); Tooltip tooltip =newTooltip(); tooltip.setValueDecimals(2); tooltip.setValueSuffix(" %"); conf.setTooltip(tooltip); ListSeries series =newListSeries("Profit Margin", values); conf.addSeries(series); PlotOptionsColumn options =newPlotOptionsColumn(); DataLabels labels =newDataLabels(); labels.setEnabled(true); labels.setFormat("{point.y:.2f}%"); options.setDataLabels(labels); options.setColor(SolidColor.LIGHTSALMON); conf.setPlotOptions(options); chart.drawChart();returnnewVerticalLayout(chartHeader, chart);}privateComponentcreateBarChartCategories()throwsFileNotFoundException{ H3 chartHeader =newH3("Mean Profit Margin by Category");loadProfitMarginData();Map<String,Double> avgByCategory = profitMarginData.stream().collect(Collectors.groupingBy( ProfitMargin::getCategory,TreeMap::new, Collectors.averagingDouble(ProfitMargin::getMeanProfit)));String[] categories = avgByCategory.entrySet().stream().sorted(Map.Entry.<String,Double>comparingByValue().reversed()).map(Map.Entry::getKey).toArray(String[]::new);Number[] values = avgByCategory.entrySet().stream().sorted(Map.Entry.<String,Double>comparingByValue().reversed()).map(Map.Entry::getValue).toArray(Number[]::new); Chart chart =newChart(ChartType.COLUMN);Configuration conf = chart.getConfiguration(); conf.getChart().setStyledMode(false); XAxis x =newXAxis(); x.setCategories(categories); x.setTitle("Category"); conf.addxAxis(x); YAxis y =newYAxis(); y.setTitle("Mean Profit Margin"); conf.addyAxis(y); Tooltip tooltip =newTooltip(); tooltip.setValueDecimals(2); tooltip.setValueSuffix(" %"); conf.setTooltip(tooltip); ListSeries series =newListSeries("Profit Margin", values); conf.addSeries(series); PlotOptionsColumn options =newPlotOptionsColumn(); DataLabels labels =newDataLabels(); labels.setEnabled(true); labels.setFormat("{point.y:.2f}%"); options.setDataLabels(labels); options.setColor(SolidColor.DARKSALMON); conf.setPlotOptions(options); chart.drawChart();returnnewVerticalLayout(chartHeader, chart);}privateComponentselectBarChart()throwsFileNotFoundException{loadProfitMarginData(); Select<String> chartSelector =new Select<>(); chartSelector.setLabel("View by"); chartSelector.setItems("Category","Sub-Category"); chartSelector.setValue("Sub-Category");Component subCategoryChart =createBarChartSubCategories();Component categoryChart =createBarChartCategories(); subCategoryChart.setVisible(true); categoryChart.setVisible(false); Div chartContainer =newDiv(subCategoryChart, categoryChart); chartContainer.setWidthFull(); chartSelector.addValueChangeListener(event ->{boolean isSub ="Sub-Category".equals(event.getValue()); subCategoryChart.setVisible(isSub); categoryChart.setVisible(!isSub);});returnnewVerticalLayout(chartSelector, chartContainer);}privatevoidloadProfitMarginData()throwsFileNotFoundException{ profitMarginData =new CsvToBeanBuilder<ProfitMargin>(newFileReader("data/Profit Margin and SubCategories.csv")).withType(ProfitMargin.class).build().parse();}
This interactive map uses bubble sizes to represent total profit in each city. If the user hover over any bubble to see detailed profit, sales, and state information:
The map was designed in Power BI and then embedded into our Vaadin application as follows:
Developed interactive dashboards using Java, Spring Boot, and Vaadin
Built personalized customer profiles and purchase-history features
Created dynamic charts, filters, and statistical controls
Analyzed regional performance, profit margins, and discount effects
Integrated a Power BI geographic visualization
Improved the overall usability and design of the application
Results and Business Value
The application gives customers and business leaders one place to explore Superstore performance.
Customers can review purchase history, understand spending patterns, and calculate key statistics. Business leaders can identify loss-producing products, compare regional and segment performance, evaluate discounts, and make faster data-driven decisions.
Skills Demonstrated
Java, Spring Boot, and Vaadin
Object-oriented programming
Data cleaning and aggregation
Java Streams
Dashboard development
User authentication
Interactive data visualization
Power BI integration
Retail analytics
UI/UX design
What I Learned
This project strengthened my ability to combine software development with business analytics. I gained experience transforming raw data into interactive applications, connecting backend logic with frontend components, and designing visualizations that make complex information easier to understand and act on.